Motivation
Traditional Chinese Medicine (TCM), with a history of thousands of years of clinical practice, plays an important role in maintaining the health of peoples of Asia, and is gaining more and more application all over the world. However, TCM is different from the modern western medicine in substance, methodology and philosophy, hindering western countries from recognizing the TCM. Therefore, to make TCM serve people all over the world better, it’s necessary to bring the ancient practice of TCM into line with modern standards, among which the elucidation of the molecular mechanism of TCM is one of important issues. However, owing to the diversity of TCM’s ingredients and the complexity of TCM’s interaction with the human body, to uncover the mechanism underlying TCM is still quite difficult. The clarification of the TCM’s molecular mechanism has become a bottleneck in TCM modernization and internationalization, which is urgently needed to be solved.
BATMAN-TCM is
Main function
The main functions of BATMAN-TCM include:
Browser compatibility
Input data type
BATMAN-TCM supports three input types: 1) Formula; 2) Herb or Herb list; 3) Compound list. The three input types are introduced in detail as below,
Type 1: Formula (Example 1)
Select input type "Formula";
Input the formula’s Pinyin name (e.g. LIU WEI DI HUANG TANG), which is case insensitive;
For this input type, only one formula each time is supported.
Type 2: Herb or Herb list(Example 2)
This input type is designed mainly for the research of a herb or a formula composed of multiple herbs.
Select input type “Herb or Herb list”;
Input the herb’s Pinyin name (e.g. REN SHEN), Latin name (Ginseng) or English name (Panax ginseng), which are case insensitive;
For this input type, multiple herbs are supported, one herb per line.
Type 3: Compound list(Example 3)
Select input type “Compound list”;
Input compounds denoted by Pubchem_CIDs or chemical structures of InChI format, each compound per line;
Such as: Pubchem_CID:867 or
InChI format:
InChI=1S/C27H30O16/c1-8-23(42-27-21(37)19(35)17(33)15(7-28)41-27)20(36)22(38)26(39-8)43-25-18(34)16-13(32)5-10(29)6-14(16)40-24(25)9-2-3-11(30)12(31)4-9/h2-6,8,15,17,19-23,26-33,35-38H,7H2,1H3/t8-,15-,17-,19+,20-,21-,22-,23-,26+,27+/m0/s1
Multiple queries
Besides the three input types above, BATMAN-TCM also supports users to simultaneously analyze multiple queries (i.e. TCM formulas/herbs or herb lists/compound lists) for combinational/comparison analyses of the multiple queries
Motivation of multiple queries (clusters):
Besides supporting the research of holistic molecular mechanism of a formula or herb, BATMAN-TCM also provides the function of combinational/comparison analyses of multiple queries (clusters).
Formula, the main therapeutic concept in TCM, is a combination of multiple herbs which are organized based on the combinatorial principle of “emperor-minister-assistant-courier” (“jun-chen-zuo-shi” in Chinese) .The “jun” herb treats the main cause or primary symptoms of a disease, the “chen” herb assists the “jun” herb to augment its therapeutic effects and relieve secondary symptoms, the “zuo” herb is often used to counteract the toxic or side-effects of other herbs and the “shi” herb generally ensures the absorption of the formula’s components and helps deliver or guide them to the target organs.
The combinational analysis function is originally designed to be used for comparing different compositive herbs of a formula and helping understand this combinational principle of a formula from molecular and systematic level. But of course this function can also be used to compare any different formulas, herbs/herb lists or compound lists for users’ own purposes.
Cluster definition and submission(Example 4)
By clicking on the “Add one cluster” button on the homepage of BATMAN-TCM, users can submit multiple queries (i.e. multiple formulas/herbs or herb lists/compound lists) to perform the combinational/comparison analyses.
Please clicking on"Example 4" on the homepage for the demo of this function’s usage, which performs the comparison/combinational analyses of the compositive herbs of the formula “Ma-huang Decoction”.
Parameter setting
Explanation of the analysis results
Parameters adjustment
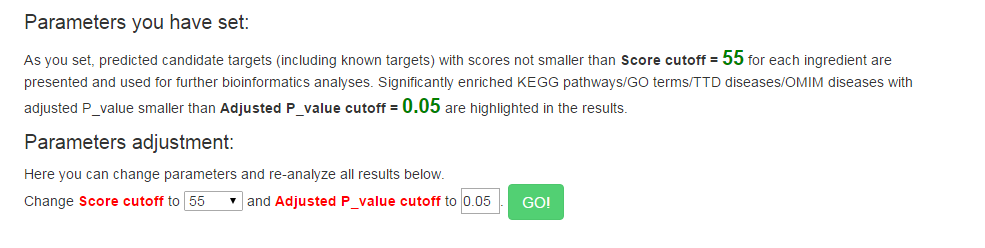
On the result page, parameter Score_cutoff and Adjusted P_value cutoff which have been set on the homepage can be changed and all the results (including Result 1, 2 and 3) will be re-analyzed (Figure 1).
Result1: Target prediction result
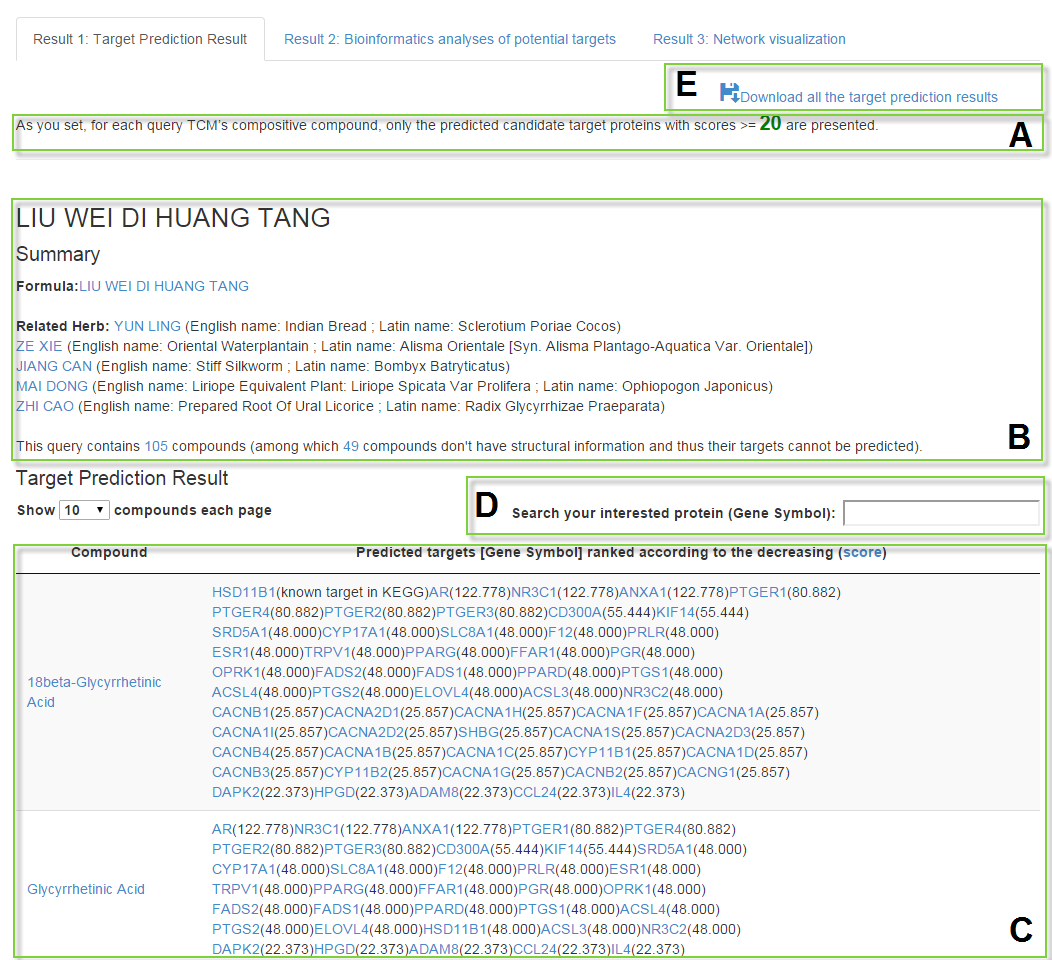
Target Prediction Result
For each ingredient of TCM, the predicted candidate targets (denoted by Gene Symbol) with scores>=Score_cutoff ranked according to the order of decreasing scores given by the target prediction method are listed in the result table.
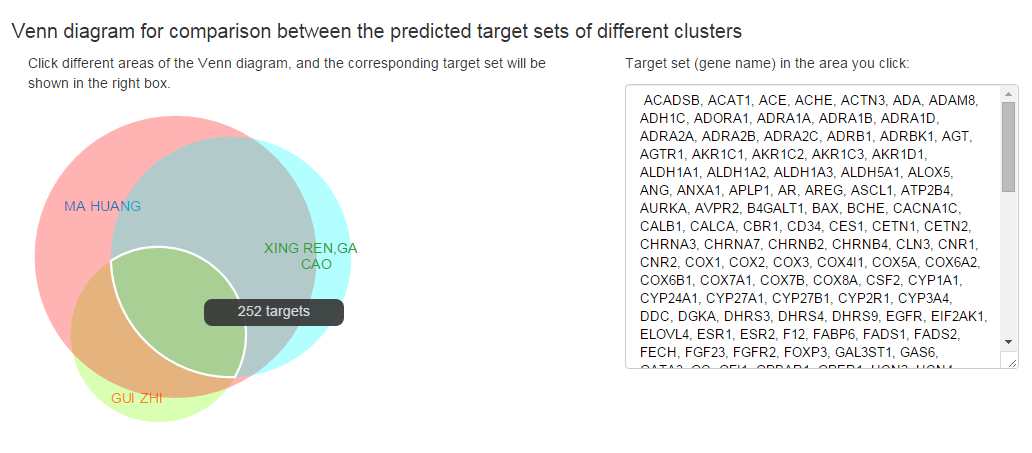
Venn diagram for comparison between the predicted target sets of different clusters
If multiple clusters are submitted by the “Add one cluster” function of BATMAN-TCM, besides the “Target Prediction Result” for each query will be presented, a Venn graph will also be produced for the comparison between the target sets of different clusters. In the Venn graph, the number of targets common to multiple clusters or specific to a cluster will be given, and clicking on the different areas of the Venn graph will lead to the corresponding target list in the right box.
Result 2: Bioinformatics analyses of potential targets
Further for these potential targets of TCM, BATMAN-TCM provides three enrichment analyses, including KEGG biological pathway, GO functional annotation and OMIM/TTD disease enrichment analyses. The significantly enriched KEGG biological pathways, GO functional terms (including biological process, molecular function and cellular component) and OMIM disease phenotypes/TTD diseases among the potential targets of TCM’s ingredients together with corresponding adjusted P-value and targets mapped to this term will be presented in the result table.
Attention: The enrichment analyses are based the predicted candidate targets with scores>=Score_cutoff (including known target).
All the enrichment analysis results can be downloaded by clicking on the link “Download all the enrichment analysis results” at the top right corner of the Result2 page.
KEGG pathway enrichment analysis result
These significantly enriched biological pathways among the potential targets of the interested TCM may play crucial roles for TCM’s therapeutic effects, providing direct clues for further experimental validation of molecular mechanism of TCM.
(1) KEGG pathway; (2) KEGG pathway with “tree view”.
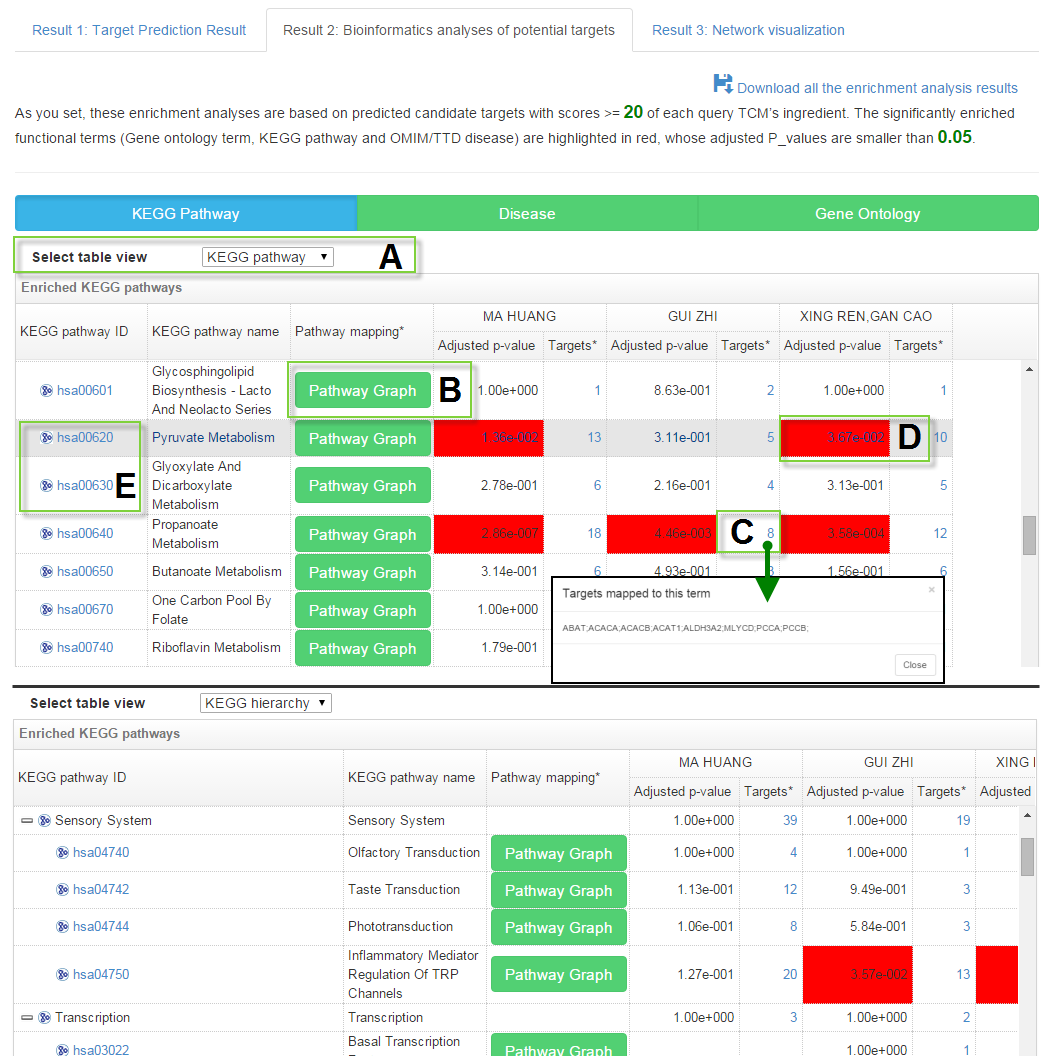
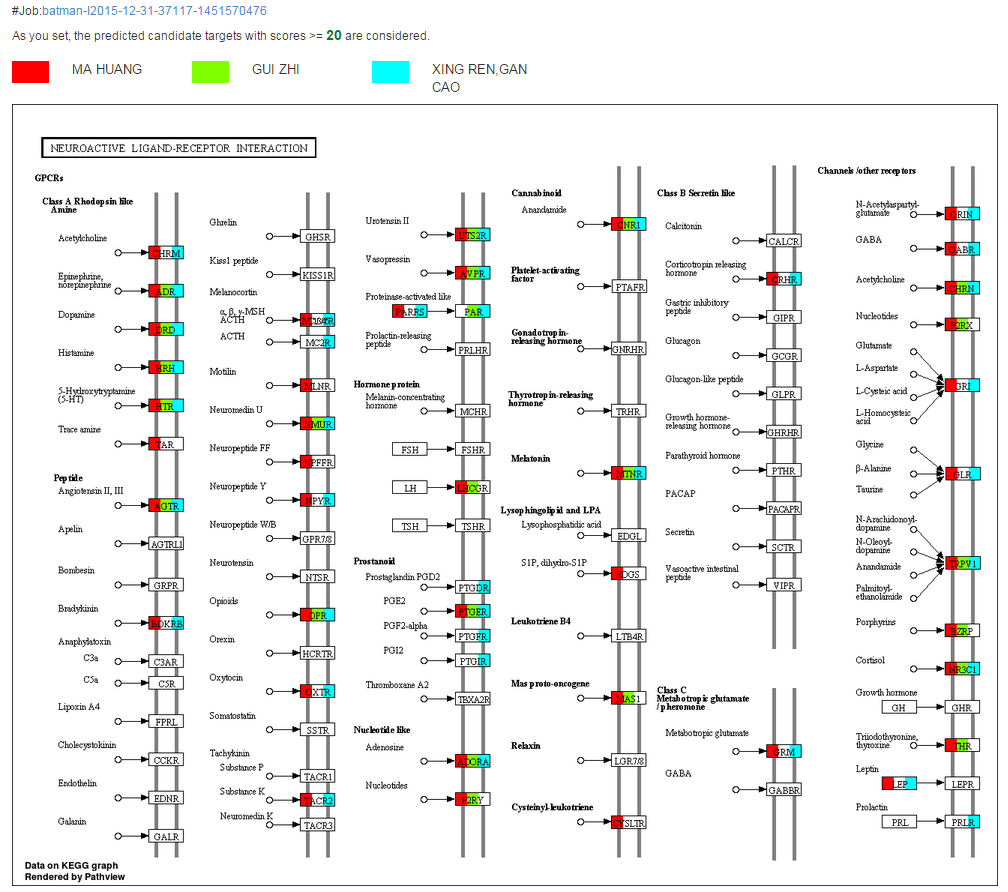
Pathway mapping
Clicking on the “Pathway Graph” will lead to the pathway view with highlighted targets (denoted by different colors for different clusters). The biological pathway view of the targets and their upstream/downstream relationship can help the deep analyses of TCM’s molecular mechanism and providing clues for further experimental validation.
This function is based on the R package of “Pathview”, which is a tool designed for pathway-based data integration and visualization. It maps and renders a wide variety of biological data on relevant pathway graphs (Luo W et al. Bioinformatics, 2013, 29(14): 1830-1831). If multiple clusters are submitted, targets from different clusters will be shown by different colors.
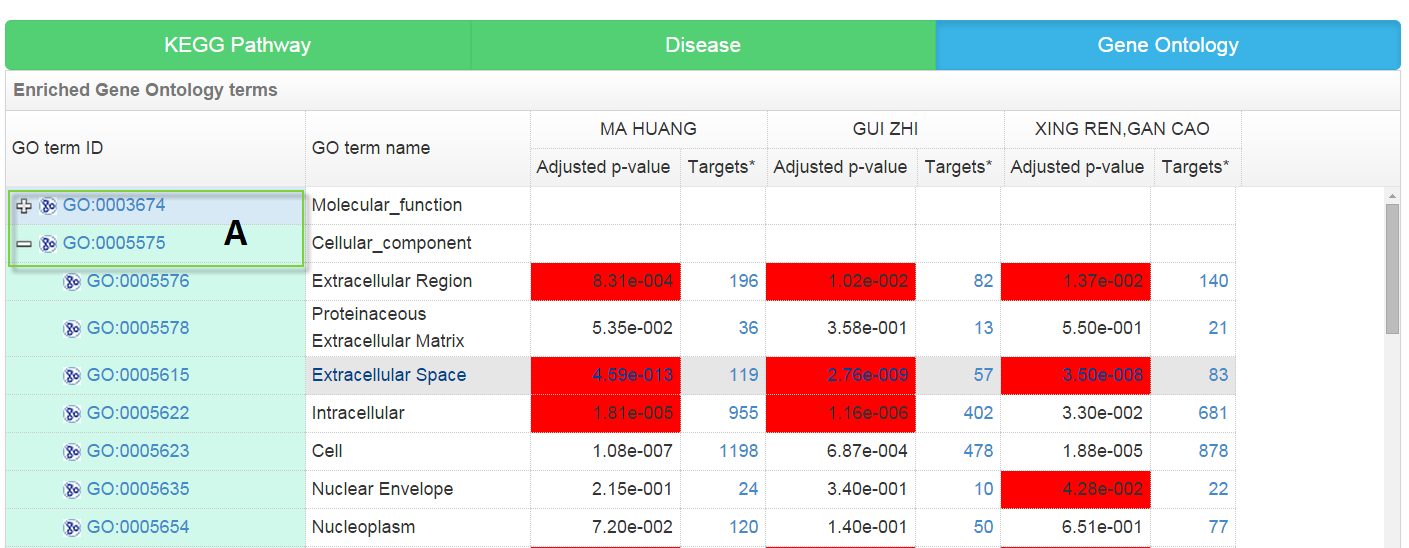
GO enrichment analysis result
The significantly enriched GO functional terms (including biological processes, molecular functions and cellular components) may play crucial roles for TCM’s therapeutic effects, also providing direct clues for the following experimental validation of molecular mechanism of TCM. The GO enrichment analysis result is presented as a tree structure which shows the hierarchical relationship between GO terms.
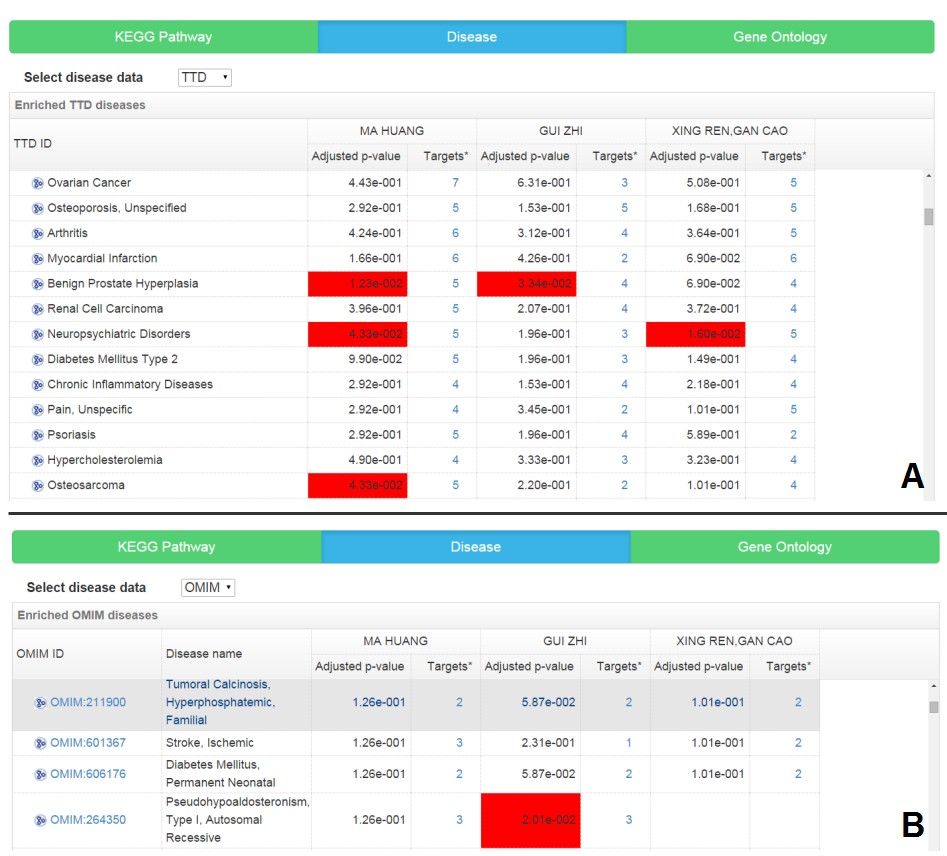
Disease enrichment analysis result
TCM is prescribed for particular “pattern” (“zheng” in Chinese), while modern western drugs are designed for treating particular disease. The overrepresented diseases among the potential targets of TCM construct the connection between TCM and diseases by targets and disease-related genes, not only bridging the gap between TCM and modern western medicine but also providing clues for exploring novel diseases on which the TCM has therapeutic effects. Here the disease-gene association data are from OMIM and TTD respectively.
Result 3: Network visualization
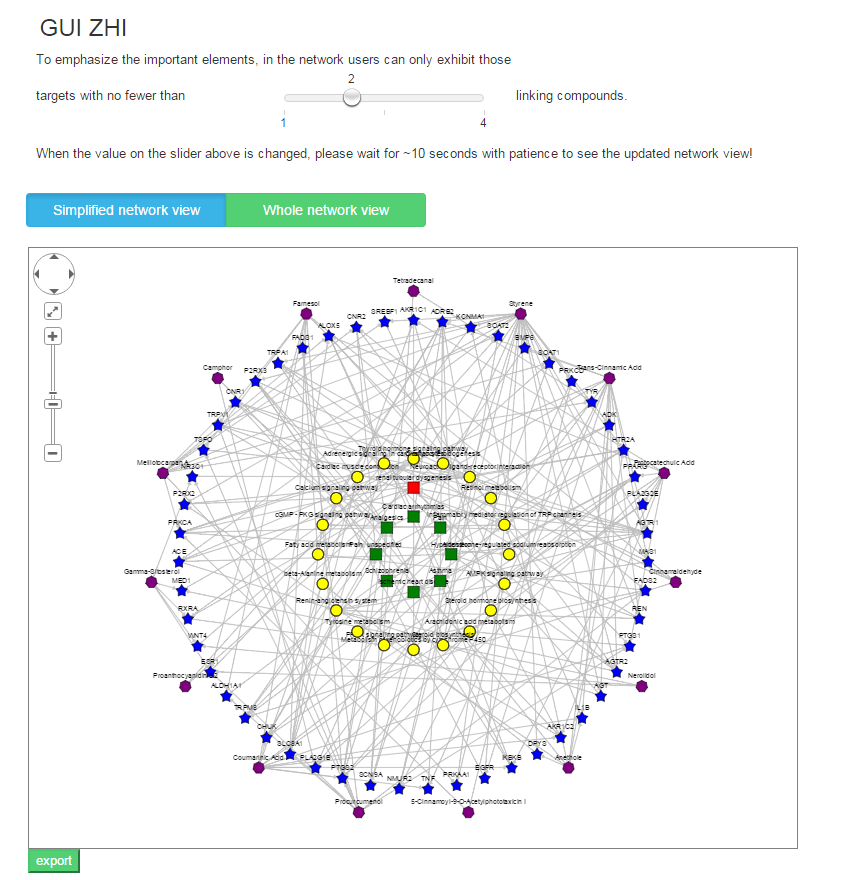
TCM is the typical “multi-component and multi-target” agent, and its molecular mechanism is especially suitable to be studied through the network-based analyses, which can capture the TCM’s complexity in a simple and intuitive way. The “ingredient-target-pathway/disease” association network helps intuitively understand the “multi-component, multi-target and multi-pathway” combinational therapeutic mechanism and the potential disease treatment mechanism of TCM.
In the association network, there are four kinds of nodes distinguished by different shapes and colors including TCM’s ingredients, targets, biological pathways and OMIM/TTD diseases and three types of edges including ingredient-target association (if the protein is known or potential target of the ingredient), target-pathway association (if the target protein is a member of the biological pathway) and target-disease association (if the target protein is a known related gene of the disease). In addition, to emphasize the important elements, the size of the target node, pathway node and disease node is proportional to their degree in the network, which is respectively defined as the number of compounds acting on the target, the number of targets involved in the pathway and the number of targets being known the disease-related genes, and meanwhile users can only exhibit those targets with more than M linking compounds (which can be adjusted by the slider on the result page) in the network.
There are two types of network view. Different from the “Whole network view”, in the “Simplified network view” only those significantly enriched pathways /diseases (adjusted P-value <= cutoff set by users) are shown in the network.
The network graph is draw based on the predicted candidate target proteins with scores>=Score_cutoff(user defined) of each query TCM’s ingredient.
The target prediction method
Here we used a similarity-based method to predict potential targets of TCM ingredients. The core idea of this method, which was first proposed by Perlman et al.[ J Comput Biol. 2011 Feb;18(2):133-45.], is to rank potential drug-target interactions based on their similarity to the known drug-target interactions.
Here drug-target prediction was treated as a binary classification problem, and the prediction model was constructed to distinguish true and false drug-target interaction. For each query drug-protein interaction, we defined the feature value of a classification feature as the largest one among the similarity scores between this query interaction and all known drug-target interactions (i.e. the golden standard positive dataset). The similarity between two drug-target interactions was calculated as the product of their drug similarity score and the target similarity score. Here we used 6 scores to measure the drug-drug similarity respectively based on chemical structure (including FP2 fingerprint-based and functional group-based similarity scores), side-effect, ATC (Anatomical, Therapeutic and Chemical) classification system, drug-induced gene expression and the text mining score of chemical-chemical association, and 3 scores to measure protein-protein similarity respectively based on protein sequence, closeness in a protein interaction network and Gene Ontology (GO) functional annotation, resulting in 18 (=6×3) features in total. After minimum redundancy maximum relevance (mRMR) feature selection, the prediction model integrating 8 features was used in BATMAN-TCM, including ATC-GO, FP2-closeness, STITCH-sequence, expression-closeness, ATC-sequence, functional_group-sequence, functional_group-GO and side_effect-sequence. For a query interaction, the maximum of the Likelihood Ratios (LRs) of the 8 features was used as the ultimate prediction score. Likelihood Ratio (LR) is referred to as the ratio of the probability of feature f observed in the golden standard positive (GSP) dataset to that in the golden standard negative (GSN) dataset, which can measure the confidence level of a feature. Generally LR>1 means the feature has the prediction ability. By comprehensive evaluation, we showed the prediction method had good prediction performance (see details in our future publication).
In BATMAN-TCM, for a query compound, we rank all candidate proteins according to the order of the decreasing prediction scores given by the prediction model, and consider proteins with high scores as the potential drug targets of the query compound.
The method for enrichment analyses
The enrichment analyses of GO functional terms, KEGG biological pathways and OMIM phenotypes/TTD diseases of a group of protein targets are all based on the hypergeometric cumulative distribution test(for KEGG pathway enrichment analysis, we exclude those targets located in >=10% KEGG pathways), and the multiple testing correction of the P-value was based on Benjamini-Hochberg correction method.
Publications
We would be very grateful if you could provide your publications based on BATMAN-TCM to us!Contact: Zhongyang Liu, liuzy1984@163.com, Beijing Proteome Research Center, Beijing, China.